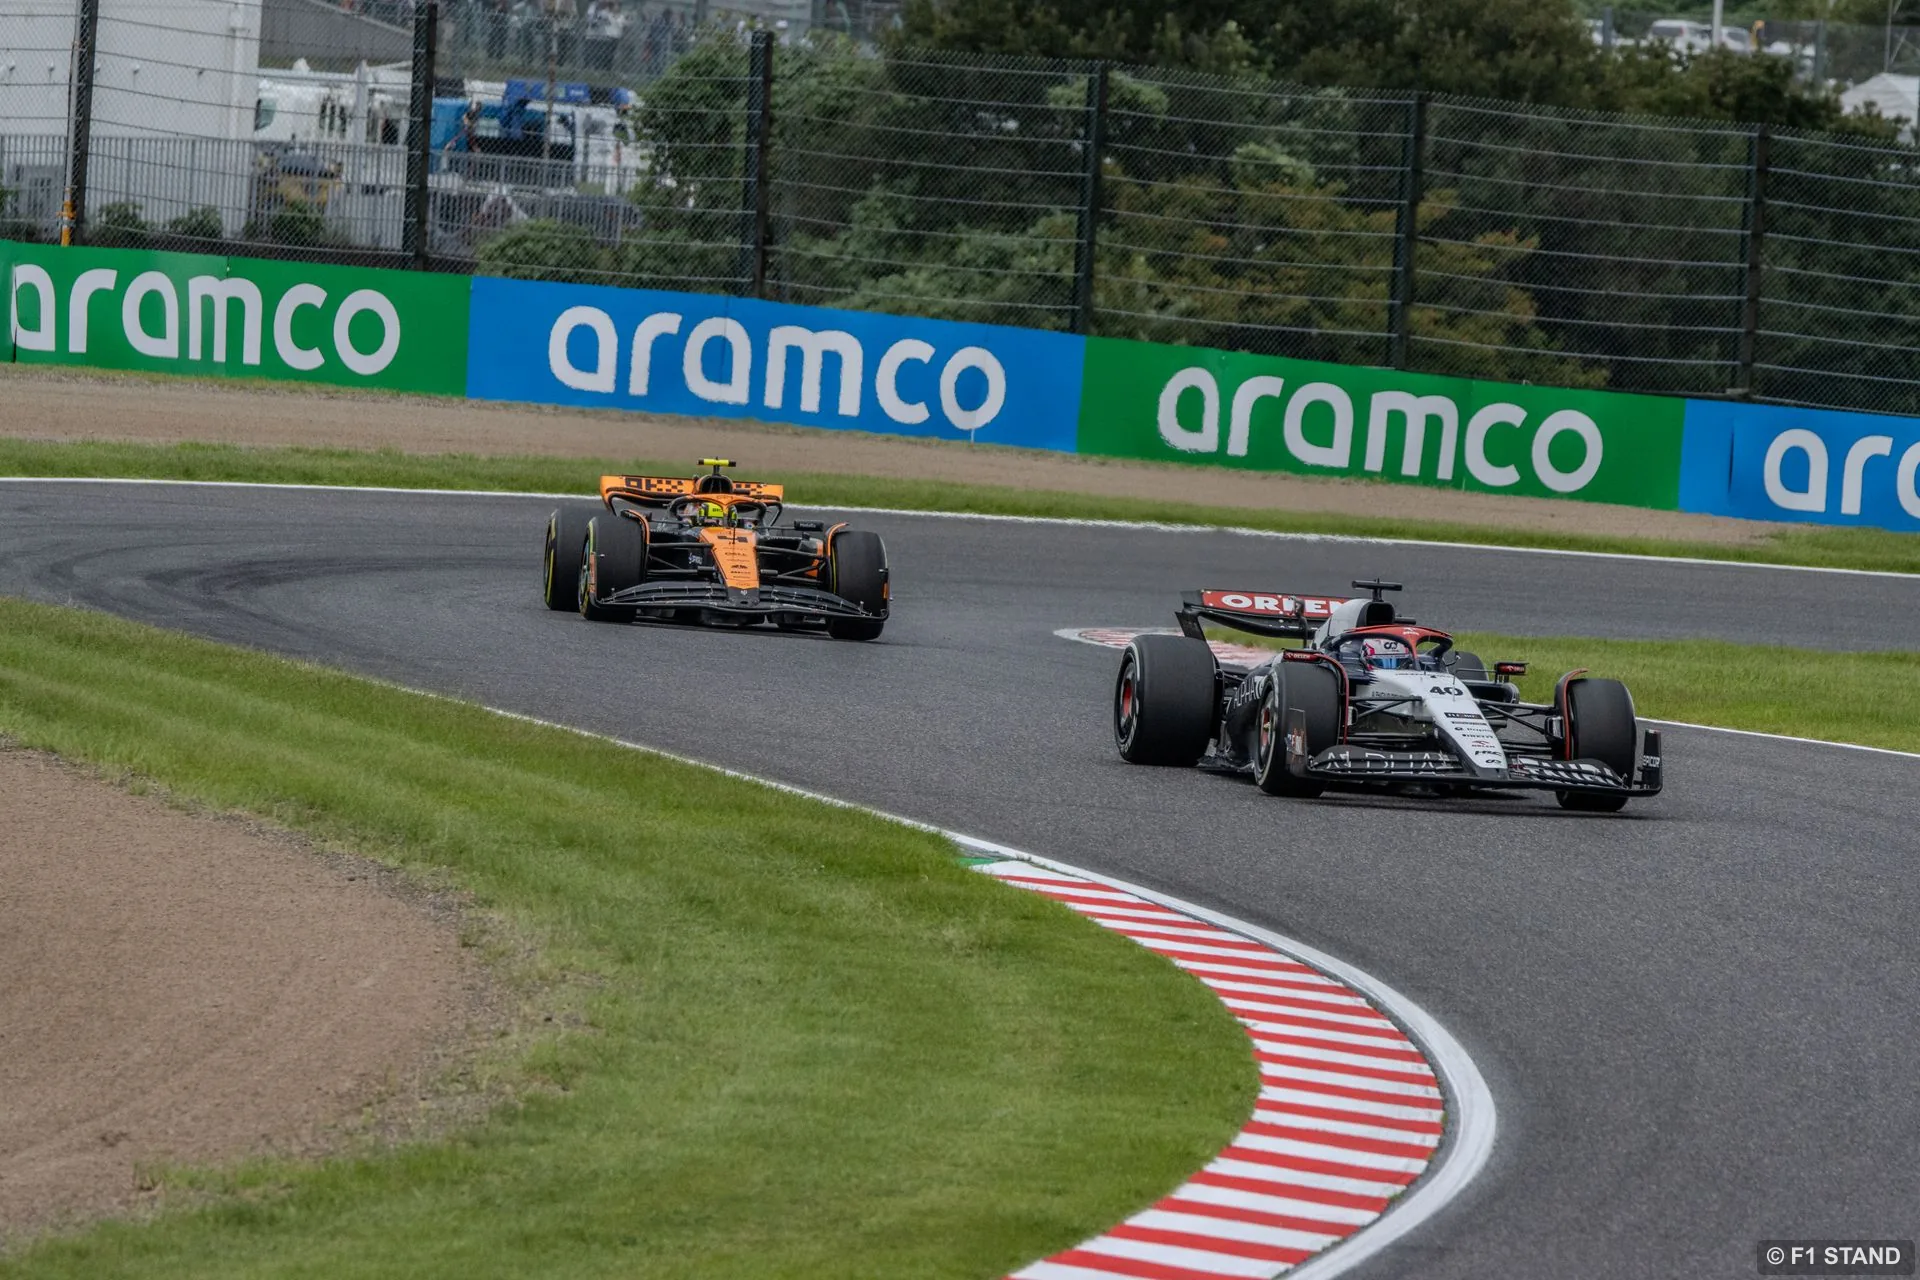
Japanese Grand Prix F1 track photo
ROUND 10Jul 17-19Finished

FORMULA 1 MOËT & CHANDON BELGIAN GRAND PRIX 2026

Circuit de Spa-Francorchamps

Spa, Belgium
Lap time chart
Y Range1:48 - 2:18

How to read the lap chart

  • The vertical axis shows lap time. Higher lines are faster laps; lower lines are slower laps.
  • Each driver line shows lap time changes lap by lap. Moving up indicates improved pace; moving down indicates time loss.
  • F marks fastest lap, P marks pit stop, R marks retirement, and D marks disqualification.

How to read the lap time chart

The lap time chart compares each driver's pace on the same timeline. It highlights fuel burn-off, post-stop improvements, safety car effects, pit laps, and unusual time losses.

Rather than focusing only on the fastest lap, it helps show stint consistency and pace drop-off across the race.